Financial Highlights
Graphs and tables of the selected financial data for the last 10 years

Consolidated
(Billions of Yen)
| FY2016 | FY2017 | FY2018 | FY2019 | FY2020 | FY2021 | FY2022 | FY2023 | FY2024 | FY2025 | |
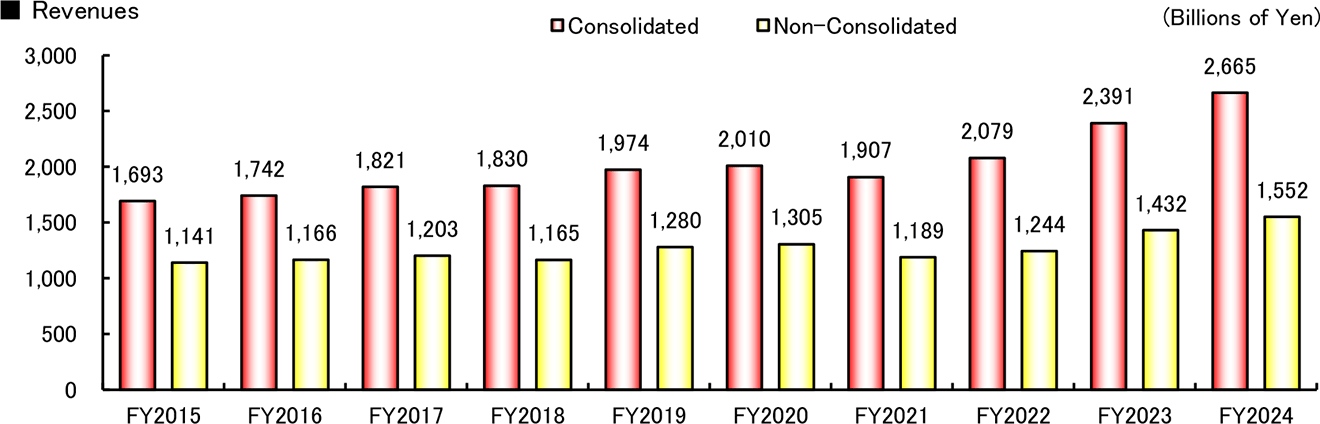
| Revenues | 1,821 | 1,830 | 1,974 | 2,010 | 1,907 | 2,079 | 2,391 | 2,665 | 2,911 | 3,067 |
| Gross Profit | 247 | 258 | 251 | 248 | 241 | 255 | 267 | 291 | 323 | 425 |
| Selling, General and Administrative Expenses | 91 | 100 | 108 | 116 | 114 | 132 | 143 | 155 | 171 | 185 |
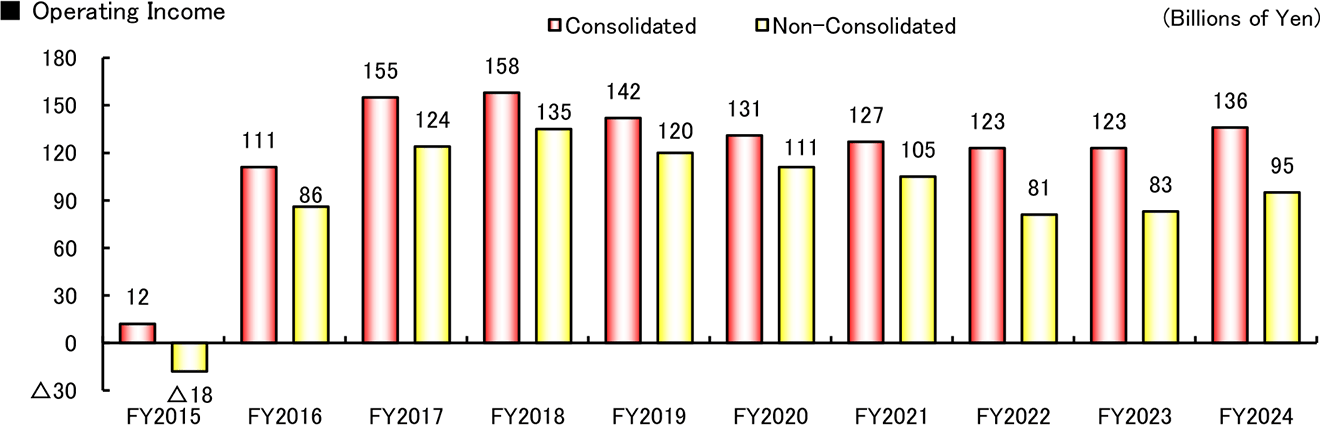
| Operating Income | 155 | 158 | 142 | 131 | 127 | 123 | 123 | 136 | 151 | 240 |
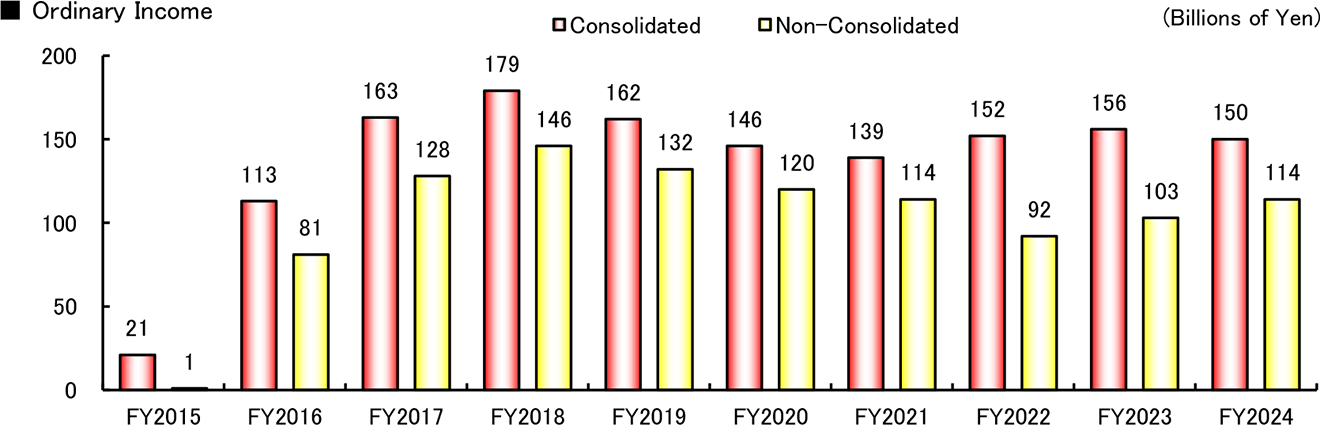
| Ordinary Income | 163 | 179 | 162 | 146 | 139 | 152 | 156 | 150 | 160 | 240 |
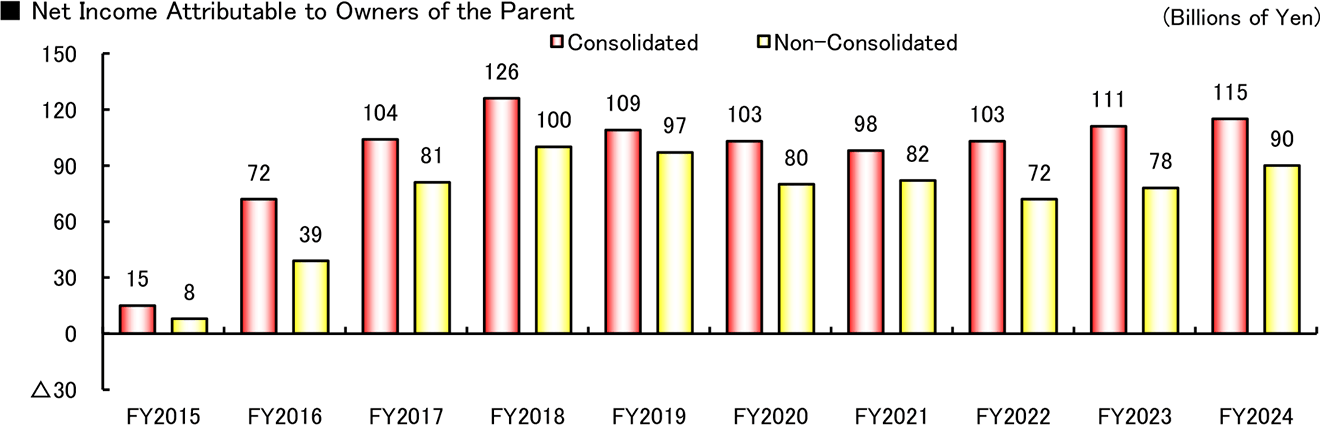
| Net Income Attributable to Owners of the Parent | 104 | 126 | 109 | 103 | 98 | 103 | 111 | 115 | 125 | 177 |
| Basic Net Income per Share (Yen) | 101.01 | 244.29 | 211.67 | 200.99 | 193.13 | 208.00 | 227.98 | 238.76 | 266.49 | 379.81 |
| Operating Margin | 8.5% | 8.7% | 7.2% | 6.6% | 6.7% | 5.9% | 5.2% | 5.1% | 5.2% | 7.8% |
| Construction Contract Awards | 1,728 | 1,685 | 2,010 | 1,752 | 1,720 | 1,929 | 2,196 | 2,927 | 2,624 | 3,263 |
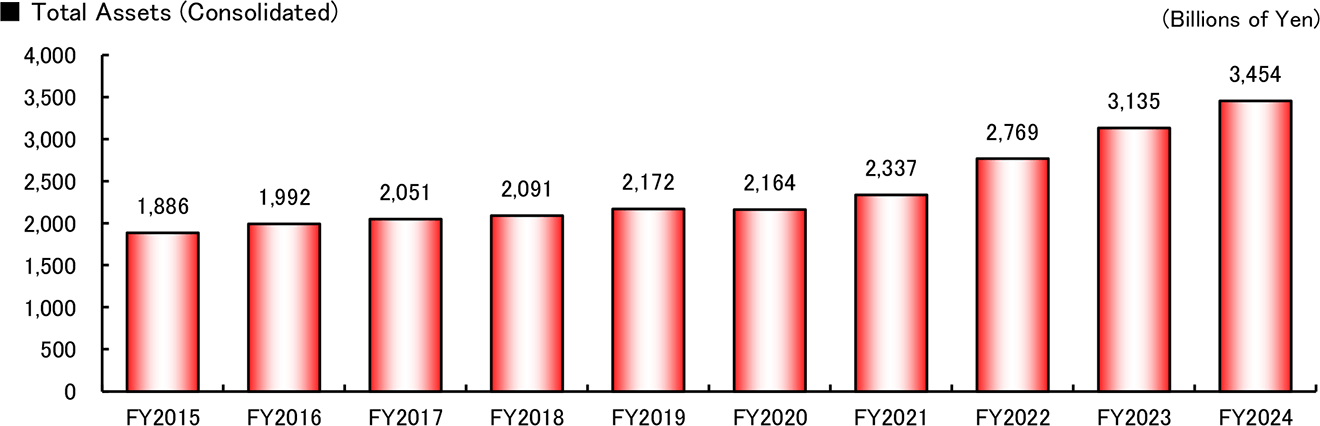
| Total Assets | 1,992 | 2,051 | 2,091 | 2,172 | 2,164 | 2,337 | 2,769 | 3,135 | 3,454 | 3,624 |
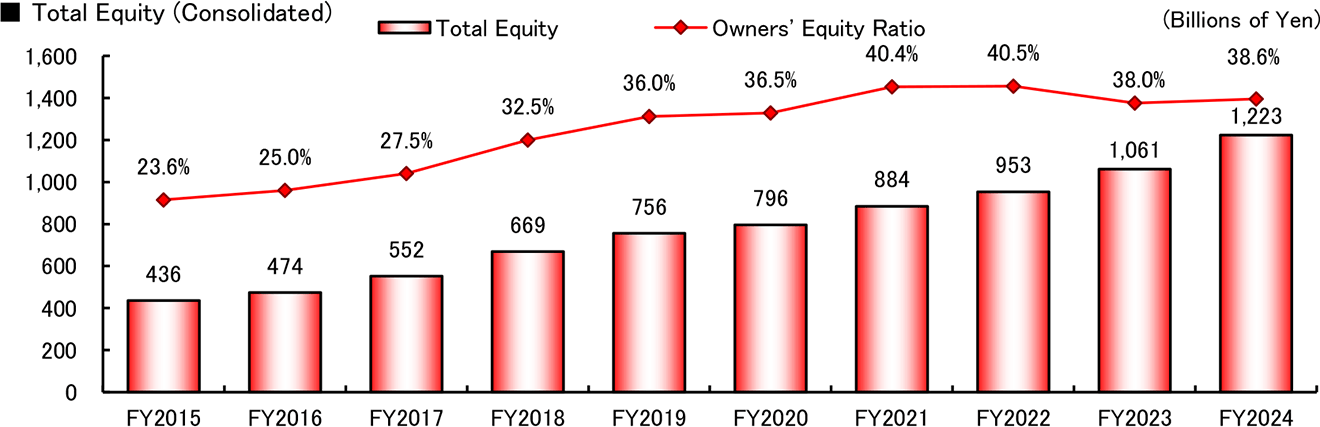
| Total Equity | 552 | 669 | 756 | 796 | 884 | 953 | 1,061 | 1,223 | 1,277 | 1,436 |
| Owners' Equity per Share (Yen) | 528.46 | 1,283.38 | 1,451.66 | 1,544.71 | 1,731.16 | 1,920.45 | 2,165.12 | 2,514.97 | 2,672.64 | 3,036.89 |
| Owners' Equity Ratio | 27.5% | 32.5% | 36.0% | 36.5% | 40.4% | 40.5% | 38.0% | 38.6% | 36.4% | 39.0% |
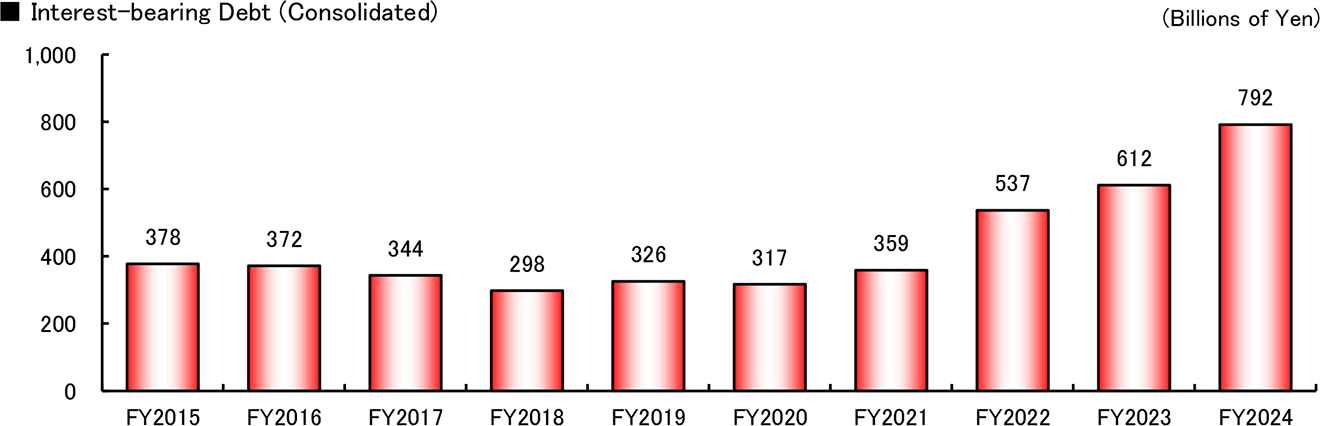
| Interesting-bearing Debt | 372 | 344 | 298 | 326 | 317 | 359 | 537 | 612 | 792 | 833 |
| ROE | 20.6% | 20.9% | 15.5% | 13.4% | 11.8% | 11.4% | 11.2% | 10.2% | 10.2% | 13.3% |
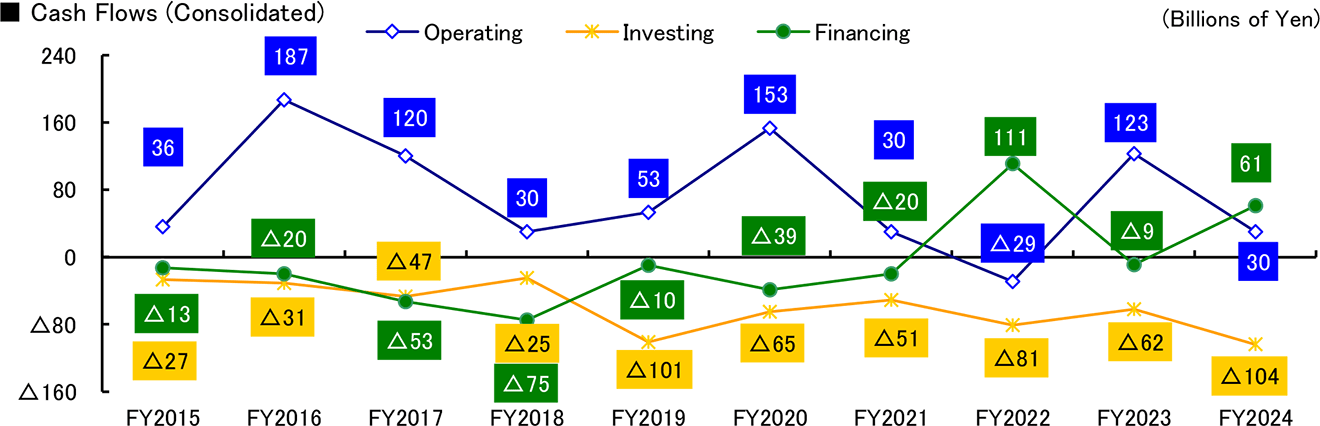
| Cash Flow - Operating Activities | 187 | 120 | 30 | 53 | 153 | 30 | △29 | 123 | 30 | 114 |
| Cash Flow - Investing Activities | △31 | △47 | △25 | △101 | △65 | △51 | △81 | △62 | △104 | △46 |
| Cash Flow - Financing Activities | △20 | △53 | △75 | △10 | △39 | △20 | 111 | △9 | 61 | △30 |
| Overseas Revenues | 402 | 461 | 457 | 470 | 490 | 624 | 740 | 861 | 1,116 | 1,095 |
| North America | 218 | 180 | 210 | 234 | 268 | 388 | 413 | 496 | 686 | 615 |
| Europe | 15 | 22 | 35 | 29 | 29 | 41 | 70 | 44 | 66 | 83 |
| Asia | 113 | 127 | 119 | 107 | 100 | 95 | 151 | 177 | 214 | 207 |
| Oceania | 54 | 107 | 92 | 98 | 91 | 96 | 103 | 140 | 145 | 184 |
| Other Area | 0 | 23 | 0 | 0 | 0 | 1 | 1 | 3 | 3 | 4 |
| Overseas Revenues / Total Revenues Ratio | 22.1% | 25.2% | 23.2% | 23.4% | 25.7% | 30.0% | 30.9% | 32.3% | 38.4% | 35.7% |
| Cash Dividends per Share (Yen) | 20.0 | 48.0 | 50.0 | 50.0 | 54.0 | 58.0 | 70.0 | 90.0 | 104.0 | 146.0 |
Non-Consolidated
(Billions of Yen)
| FY2016 | FY2017 | FY2018 | FY2019 | FY2020 | FY2021 | FY2022 | FY2023 | FY2024 | FY2025 | |
| Revenues | 1,203 | 1,165 | 1,280 | 1,305 | 1,189 | 1,244 | 1,432 | 1,552 | 1,560 | 1,710 |
| Gross Profit | 178 | 192 | 181 | 177 | 171 | 154 | 157 | 172 | 194 | 267 |
| Selling, General and Administrative Expenses | 53 | 57 | 60 | 66 | 66 | 73 | 74 | 77 | 80 | 89 |
| Operating Income | 124 | 135 | 120 | 111 | 105 | 81 | 83 | 95 | 114 | 177 |
| Ordinary Income | 128 | 146 | 132 | 120 | 114 | 92 | 103 | 114 | 126 | 190 |
| Net Income | 81 | 100 | 97 | 80 | 82 | 72 | 78 | 90 | 104 | 146 |
| Basic Net Income per Share (Yen) | 78.60 | 192.96 | 186.74 | 155.72 | 162.06 | 144.29 | 159.61 | 186.72 | 221.42 | 314.04 |
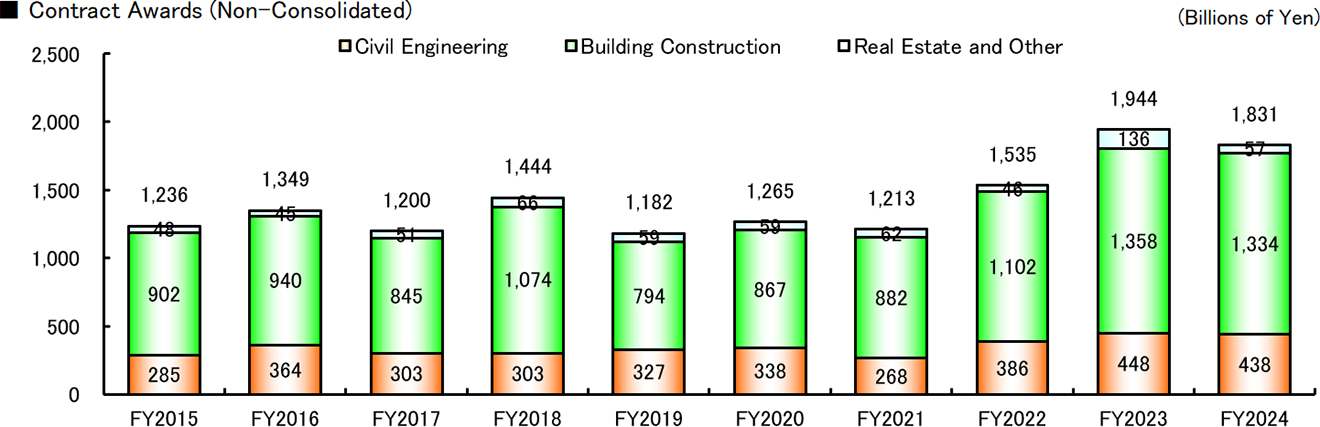
| Contract Awards | 1,349 | 1,200 | 1,444 | 1,182 | 1,265 | 1,213 | 1,535 | 1,944 | 1,831 | 2,275 |
| Civil Engineering | 364 | 303 | 303 | 327 | 338 | 268 | 386 | 448 | 438 | 615 |
| Building Construction | 940 | 845 | 1,074 | 794 | 867 | 882 | 1,102 | 1,358 | 1,334 | 1,555 |
| Total Construction ・・・ (A) | 1,304 | 1,148 | 1,377 | 1,122 | 1,205 | 1,150 | 1,489 | 1,807 | 1,773 | 2,171 |
| Real Estate and Other | 45 | 51 | 66 | 59 | 59 | 62 | 46 | 136 | 57 | 103 |
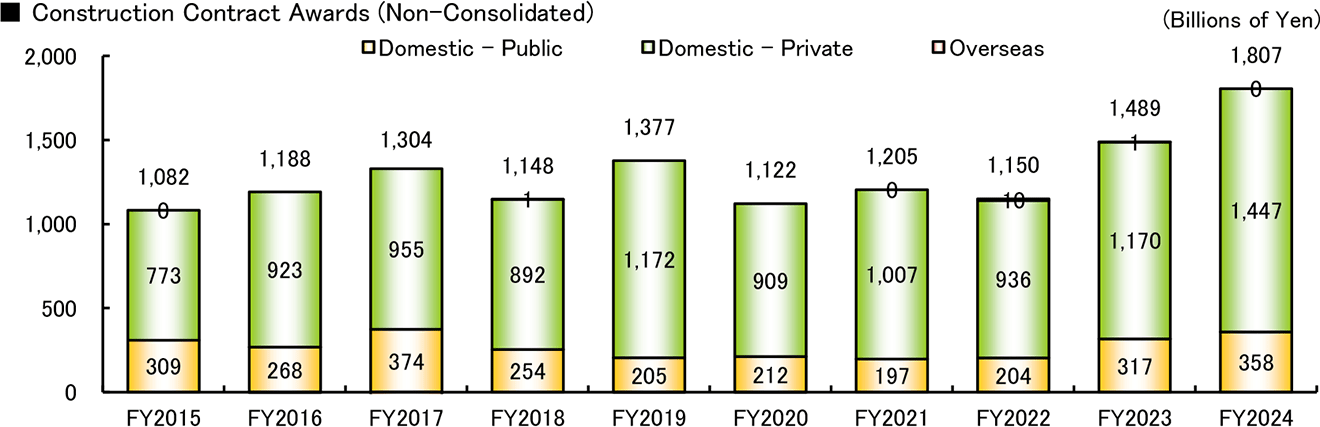
| Construction Contract Awards ・・・ (A) | ||||||||||
| Domestic - Public | 374 | 254 | 205 | 212 | 197 | 204 | 317 | 358 | 264 | 485 |
| Domestic - Private | 955 | 892 | 1,172 | 909 | 1,007 | 936 | 1,170 | 1,447 | 1,468 | 1,680 |
| Overseas | △25 | 1 | △0 | △0 | 0 | 10 | 1 | 0 | 39 | 5 |
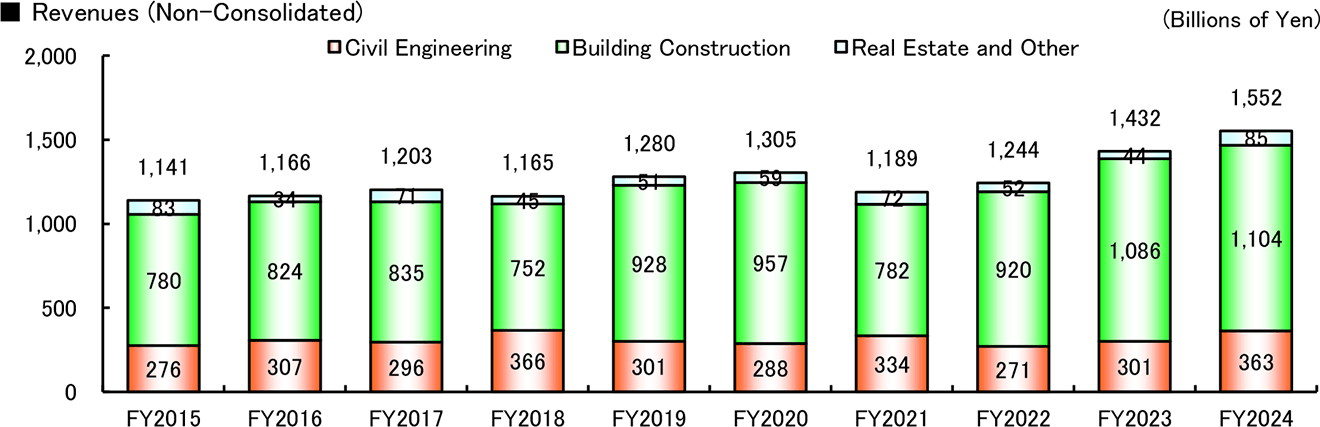
| Revenues | 1,203 | 1,165 | 1,280 | 1,305 | 1,189 | 1,244 | 1,432 | 1,552 | 1,560 | 1,710 |
| Civil Engineering | 296 | 366 | 301 | 288 | 334 | 271 | 301 | 363 | 404 | 430 |
| Building Construction | 835 | 752 | 928 | 957 | 782 | 920 | 1,086 | 1,104 | 1,053 | 1,182 |
| Total Construction | 1,132 | 1,119 | 1,229 | 1,245 | 1,117 | 1,192 | 1,387 | 1,467 | 1,457 | 1,613 |
| Real Estate and Other | 71 | 45 | 51 | 59 | 72 | 52 | 44 | 85 | 102 | 96 |
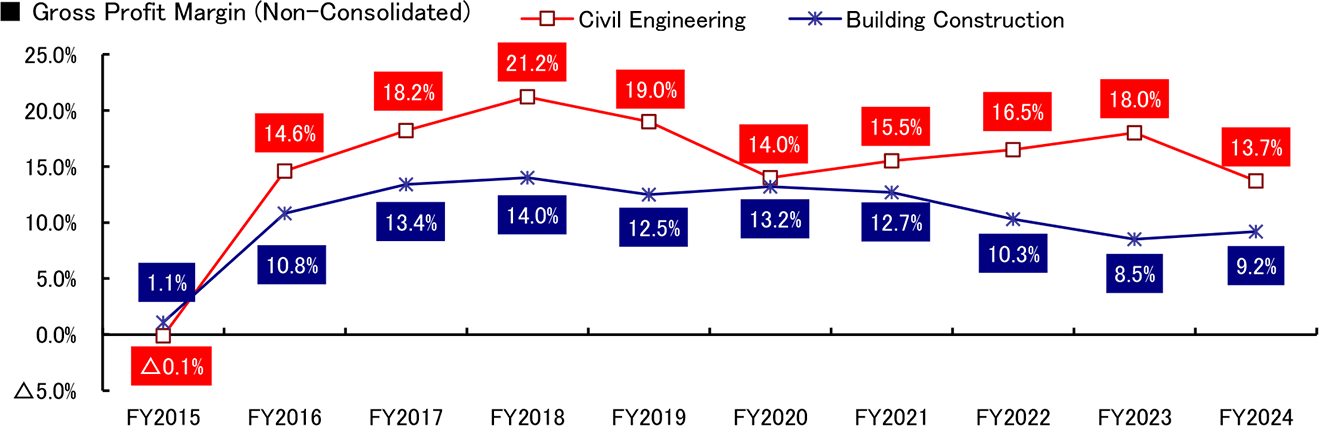
| Gross Profit Margin | 14.7% | 16.4% | 14.1% | 13.4% | 13.6% | 11.7% | 10.6% | 10.3% | 11.2% | 15.2% |
| Civil Engineering | 18.2% | 21.2% | 19.0% | 14.0% | 15.5% | 16.5% | 18.0% | 13.7% | 15.4% | 24.6% |
| Building Construction | 13.4% | 14.0% | 12.5% | 13.2% | 12.7% | 10.3% | 8.5% | 9.2% | 9.6% | 11.8% |
| Total Assets | 1,529 | 1,535 | 1,546 | 1,593 | 1,558 | 1,642 | 1,764 | 1,918 | 2,046 | 2,165 |
| Total Equity | 370 | 465 | 545 | 563 | 638 | 656 | 693 | 791 | 778 | 891 |
| Owners' Equity per Share (Yen) | 356.30 | 895.59 | 1,049.18 | 1,096.69 | 1,261.00 | 1,330.57 | 1,423.48 | 1,641.52 | 1,650.44 | 1,910.46 |
| Owners' Equity Ratio | 24.2% | 30.3% | 35.3% | 35.3% | 41.0% | 40.0% | 39.3% | 41.3% | 38.0% | 41.2% |
| Interesting-bearing Debt | 287 | 262 | 203 | 222 | 177 | 199 | 209 | 169 | 288 | 307 |
(Note)1. The Company consolidated its shares at a rate of one share for every two shares, effective October 1, 2018.
Accordingly, the figures for FY2017 and FY2018 are calculated as if the consolidation of shares had been conducted at the beginning of FY2017.
(Note)2. From the beginning of FY2018, Kajima corporation has applied "Partial Amendments to Accounting Standard for Tax Effect Accounting" (ASBJ Statement No.28 issued on February 16, 2018). Accordingly, the figures for FY2017 were reclassified to reflect this change.
(Note)3. From the beginning of FY2021, the company has applied “Accounting Standard for Revenue Recognition" (ASBJ Statement No.29 revised on March 31, 2020) and relevant implementation guidance.
![]() This symbol represents a PDF file.
This symbol represents a PDF file.  Adobe Reader is required to download this file for viewing and printing.